What this information page covers

Who this page is for
Use this as a reference when you are assessing whether our approach fits your research questions, governance expectations, and infrastructure constraints.
Our working method
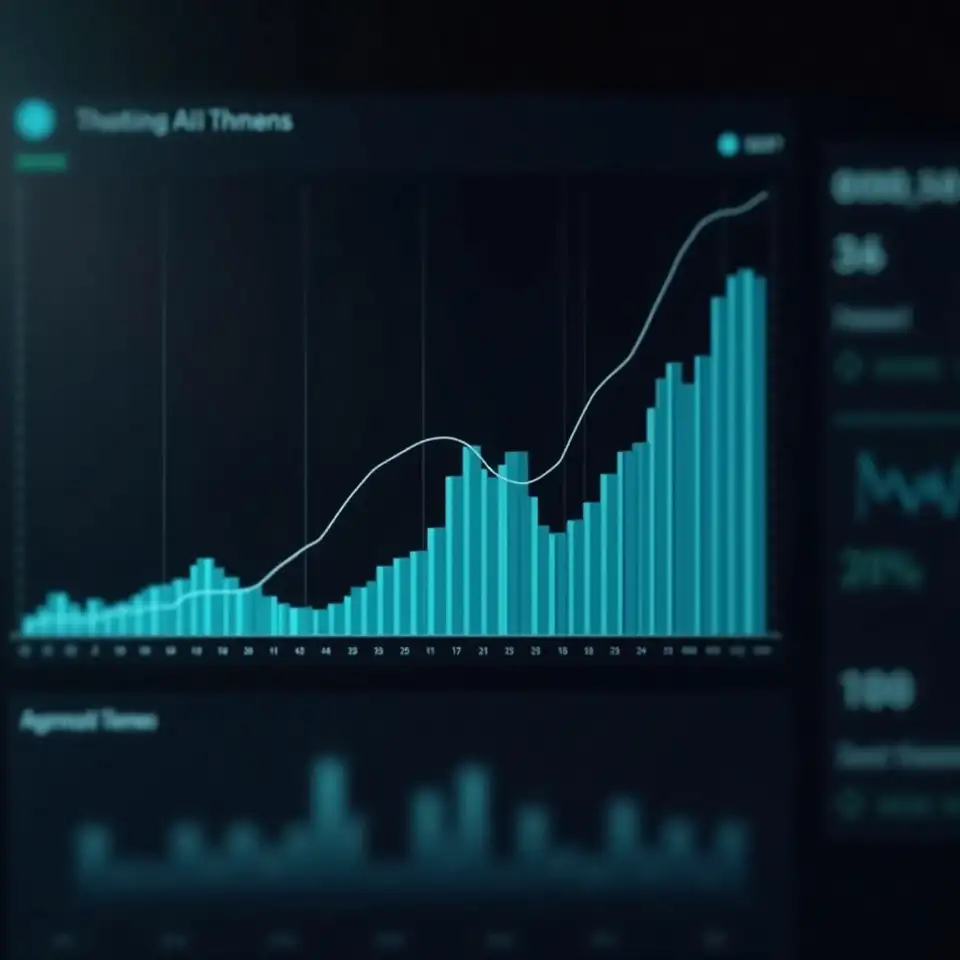
Our work is built around a simple method we call Data, Shape, Context. First, we stabilise the input data by documenting sources, cleaning rules, and any structural breaks that may affect distribution estimates. Second, we examine distributional shape using a mix of statistical and AI-based approaches, comparing how different models represent central regions and tails. Third, we frame results in the context of your existing research questions, governance standards, and documentation needs. This structure is not a rigid product; it is a way of thinking that guides every engagement. It helps ensure that when you look at a distribution chart, you know which assumptions stand behind it and where caution is warranted. Results may vary, and we treat that variability as a feature of the process, not a flaw to be hidden. Past performance doesn't guarantee future results, and our tools are designed to keep that sentence visible in daily use.
How to read our information and use it inside your organisation
We question our own assumptions so that when you question them, the conversation moves quickly to what matters: how to interpret distributions in the context of your mandates and constraints.
Our work starts with the recognition that every distribution you see on a chart is a story about the past and a hypothesis about the future. AI-based methods allow us to tell that story in more detail, but they do not make it certain. We respond by comparing multiple model families, testing how they represent tails, and documenting where each approach is fragile. This gives your teams a clearer sense of what the models know, what they do not know, and where results may vary most.
Finally, we treat ongoing review as part of the process. As markets shift and expectations around AI evolve, we revisit our methods, diagnostics, and documentation practices. We update how we present uncertainty, adjust how we frame tails, and refine how we describe appropriate use. The constant is our stance: models support judgement; they do not replace it. This page is one way we keep that stance visible and accountable.
How to evaluate whether our approach fits your team
You may be evaluating whether AI-based return distribution estimation belongs in your research stack, or simply trying to understand how we think about risk and uncertainty. This section explains how to approach that evaluation.
Start by treating every example on our site as illustrative, not prescriptive. Distribution charts, scenario descriptions, and tail-focused narratives are designed to show how AI-based methods can represent uncertainty, not to suggest that any specific pattern will repeat. Use them as prompts for internal discussion: which parts feel aligned with your experience, which feel optimistic or conservative, and where would you want more documentation before relying on similar outputs in your own work.
Next, map our themes against your governance and infrastructure. Consider how documented modelling choices, explicit tail focus, and integration with existing tools would fit into your approval processes and reporting cycles. Ask where additional controls, validation steps, or independent reviews would be required for your environment. Results may vary, and your internal frameworks should assume that variability from the outset rather than treating it as an afterthought.
Finally, if you decide to explore a conversation with us, come with questions that reflect your constraints as much as your ambitions. Share how your teams currently handle scenario analysis, tail discussions, and option-related research, and where you feel blind spots. Our role is not to offer simple answers, but to discuss how AI-based return distribution estimates might provide a clearer, documented backdrop for the decisions you already own. Past performance doesn't guarantee future results, and we will keep that sentence in view together.
How teams typically use our AI-based distribution estimates
Institutional teams approach us with different entry points: some are focused on tail risk, others on option-related structures, others on scenario narratives that feel incomplete. Below are examples of how AI-based return distribution estimation can support those conversations in practice, always with documentation and caveats front and centre.

Option-focused research support
When you are exploring option-related research, a single volatility number can leave too much unsaid. By estimating full return distributions, you can examine how probability mass shifts across different regions of the payoff space. This helps frame internal discussions about potential tail outcomes, hedging ideas, and scenario design, while keeping clear that these are approximations and that results may vary over time.
Tail risk and oversight
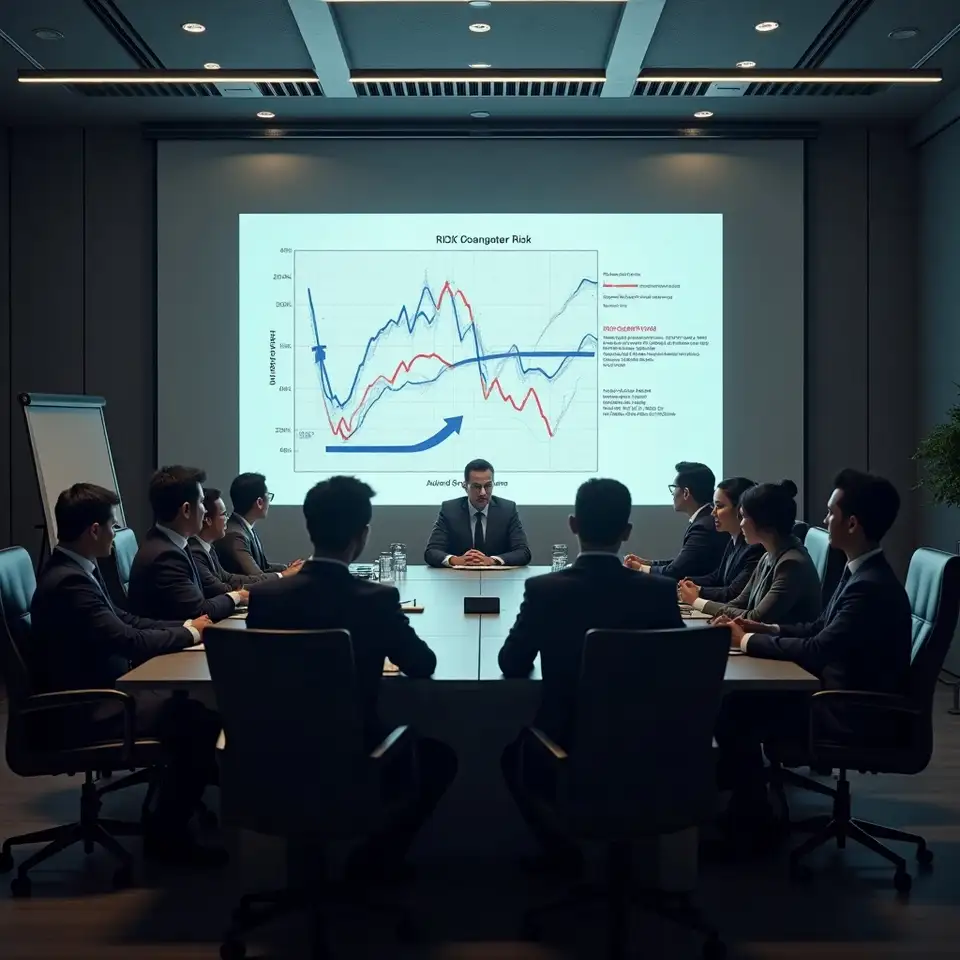
Risk and oversight teams often need to understand how severe moves might appear across scenarios, without treating any one path as a prediction. AI-based return distribution estimates can help by showing how often large moves appear in simulations and how sensitive that picture is to modelling choices. With documentation and caveats such as Past performance doesn't guarantee future results, committees gain a structured way to debate uncertainty.

Data and workflow integration
Data and research teams carry the responsibility of connecting analytical ideas to operational systems. Our focus on integration means working with existing feeds, formats, and reporting tools where possible, so that distribution estimates can appear alongside other research outputs. This allows probabilistic views of returns to become part of routine workflows rather than isolated experiments.
Key information about our AI-based return distribution estimation for institutional research teams
How we operate

Key themes in how we work with AI-based return distributions
You work in a setting where a single chart can trigger questions from risk, compliance, and senior leadership. When those charts show AI-based return distributions, you need confidence that the story behind them is documented and defensible. The points below summarise the practical themes that shape how we operate at Calytheraon when we work with institutional financial market research teams.
Documented modelling choices
Explicit tail focus
Our workflows are designed to highlight tail behaviour rather than smooth it away. We explore how often extreme outcomes appear across simulations, how sensitive those frequencies are to different windows or regimes, and how alternative distributional assumptions change the picture. This gives you a structured way to discuss severe moves without presenting any scenario as a forecast or promise.
Governance-aware design
We align our processes with the governance structures you already have. That means supporting documentation for committees, clarifying appropriate use of outputs, and framing caveats in language that non-technical stakeholders can follow. We do not bypass risk or compliance functions; we design our work so that it can be evaluated within their frameworks.